The EVOLVE Algorithm In Action

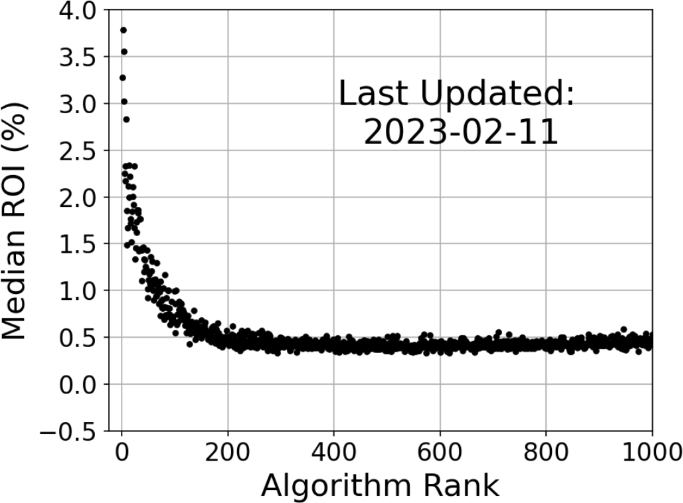
Below is the median realized ROI for all ranked Puts going back to April 16, 2021.
That's more than 120,000 Puts!

chart example

Higher-ranked Puts perform better than lower-ranked Puts! That means the EVOLVE algorithm is doing its job. If you want to examine performance for any specific week, use the interactive list below.

Algorithm Rank
Stock Ticker Symbol
Expiration Date
Strike Price ($)
Week Open Price ($)
Premium ($)
ROI (%)
Week Close Price ($)
Win or Loss?
1
UVXY
2022-01-28
15.50
17.20
130
8.39
16.95
2
UVXY
2022-01-28
16.00
17.20
156
9.75
16.95
3
UVXY
2022-01-28
15.00
17.20
105
7.0
16.95
4
UVXY
2022-01-28
16.50
17.20
185
11.21
16.95
5
AVXL
2022-01-28
11.00
12.38
55
5.0
12.17
6
UVXY
2022-01-28
14.50
17.20
81
5.59
16.95
7
UVXY
2022-01-28
17.00
17.20
216
12.71
16.95
8
AVXL
2022-01-28
10.00
12.38
35
3.5
12.17
9
AVXL
2022-01-28
12.00
12.38
95
7.92
12.17
10
UVXY
2022-01-28
14.00
17.20
62
4.43
16.95
11
VXX
2022-01-28
21.50
23.20
106
4.93
22.95
12
VXX
2022-01-28
22.00
23.20
133
6.05
22.95
13
BBIG
2022-01-28
2.50
3.19
12
4.8
2.92
14
VXX
2022-01-28
21.00
23.20
85
4.05
22.95
15
AVXL
2022-01-28
9.00
12.38
25
2.78
12.17
16
HOOD
2022-01-28
12.00
12.98
64
5.33
12.73
17
SOXS
2022-01-28
4.50
4.95
20
4.44
5.40
18
HOOD
2022-01-28
11.00
12.98
33
3.0
12.73
19
UVXY
2022-01-28
13.50
17.20
45
3.33
16.95
20
PTON
2022-01-28
24.00
27.06
86
3.58
25.64